Cleaning Learning Logs Before an Early-Warning Model
Background
Online course platforms want to identify students who are likely to fail or withdraw early enough to intervene. The usual approach builds a feature table from activity logs and assessment records a few weeks into the course, then scores every enrolled student.
The feature table is assembled from several tables exported from different systems. Some records describe students who never started, some values are coded inconsistently, and the same event can appear more than once. A model trained on this table is fitted to these records along with student behavior, and the list of flagged students depends on both.
Product Question
How much does cleaning the exported tables change which students a week-4 early-warning model flags and how well the model appears to perform?
Data
Open University Learning Analytics Dataset (OULAD)
Kuzilek et al. (2017) released records for 32,593 enrollments across 22 presentations of 7 modules at the Open University. The data are seven relational tables covering course structure, assessments, virtual learning environment (VLE) materials, student demographics, registrations, assessment submissions, and daily click logs. The click-log table has 10.6 million rows. The data are publicly available on figshare under a CC-BY 4.0 license.
Analysis Sample
- Registrations that ended on or before the first day of the course excluded
- Registrations whose final result and unregistration date disagree excluded
After these restrictions, the analysis sample contained 29,402 enrollments. The raw comparison used all 32,593.
Variables Used
- Daily click counts per VLE site
- Assessment due dates, submission dates, and scores
- Registration and unregistration dates
- Final result, one of Pass, Distinction, Fail, and Withdrawn
A student id identifies a person, not an enrollment. The same student can appear in several presentations, so every join between student-level tables uses module and presentation together with the student id.
Problem Definition
Four profiling checks on the exported tables expose four kinds of problems. Each problem below names the check that exposes it.
Students Who Never Started
The registration table includes students who withdrew on or before the first day of the course.
The column profile shows a minimum date_unregistration below zero. These students have no activity and a final result of Withdrawn. Their outcome follows from zero clicks, and a flag on these students cannot be acted on during the course.
Contradictory Status
The final result and the unregistration date do not always agree.
A cross-tabulation of the two columns shows students recorded as Withdrawn with no unregistration date, and a few with an unregistration date and a result other than Withdrawn. Either the outcome label or the exposure window is wrong for these students.
Inconsistent Coding
The same category is written more than one way, and missing values are written as text.
The value counts for imd_band list eleven categories where the documentation describes ten. Nine bands are written as 0-10%, 20-30%, and so on, and one is written as 10-20 without the percent sign. The column profile also shows missing values stored as ? in some tables and as empty strings in others, and a null exam date for half of the exams.
Duplicate Keys in the Click Log
The same student-site-day combination appears more than once.
The log is documented as one row per student, site, and day. The key check finds that a fifth of the click-log rows share a key with another row. Any count of rows, as opposed to a sum of clicks, is inflated for the affected students.
Objective
Define each cleaning rule as a logged step, record how many rows it affects, build the same week-4 features from the raw and cleaned tables, and measure how the cleaning changes the students an early-warning model flags and the metrics used to evaluate it.
Methods
The analysis was conducted in R using four main packages.
| Package | Purpose |
|---|---|
duckdb | Query the seven CSV files in place without loading them into R memory |
DBI | Send SQL from R and return results as data frames |
purrr | Run the same profiling query across every table and column |
ggplot2 | Visualize the cleaning log and the change in predicted risk |
Query the Files In Place
DuckDB is an in-process analytical database. Each CSV was registered as a table with read_csv_auto, treating both empty strings and ? as missing. The cleaning rules were written as SQL CREATE TABLE ... AS SELECT statements, so each step produced a named intermediate table whose row count was logged. R handled the logging, the model, and the figures.
Profile Every Table the Same Way
Before any rule was written, four checks were run on all seven tables.
- Column profile. DuckDB’s
SUMMARIZEreturns the minimum, maximum, approximate distinct count, and null share of every column. Out-of-range values and unexpected nulls appear here. - Value counts. Every text column with 20 or fewer distinct values was tabulated. A category written two ways appears as an extra row.
- Key duplicates. Each table was grouped by its documented key, and the groups with more than one row were counted.
- Foreign keys. Each child table was anti-joined to its parent on the documented key, and the unmatched rows were counted.
The cross-tabulation of final_result against whether date_unregistration is null was the one table-specific check, added because both columns describe the same event.
Define Cleaning Rules as Logged SQL Steps
Each rule removes rows, recodes values, imputes a value, collapses duplicates, or flags rows for exclusion downstream. Rules were applied in the order below, and the number of rows affected was recorded after each one.
imd_bandvalue10-20recoded to10-20%- Missing exam dates set to the presentation length, the documented convention for final exams
- Students with
date_unregistration≤ 0 flagged as never started - Students whose
final_resultand unregistration date disagree flagged as status conflicts - Submissions checked against
assessmentsandstudentInfo, and scores checked against the range 0-100 - Click records checked against
vle,studentRegistration, and the presentation date window - Duplicate (student, assessment) submissions resolved by keeping the latest, using
ROW_NUMBER() OVER (PARTITION BY id_student, id_assessment ORDER BY date_submitted DESC) - Submissions with a missing score flagged and kept as not scored
- Duplicate (student, site, date) click records collapsed by summing clicks
Build Week-4 Features
For each enrollment, the following features were computed from records dated on or before day 28.
- Total clicks and number of active days
- Days since the last click, with a ceiling for students who never clicked
- Whether the first tutor-marked assessment (TMA) was due by day 28, and if so its score, whether it was missing, and whether it was submitted late
The same SQL was run against the raw and cleaned tables.
Compare the Flag Before and After Cleaning
The outcome was a final result of Fail or Withdrawn. A logistic regression on the seven features was trained on the 2013 presentations and evaluated on the 2014 presentations. Students in the top 20% of predicted risk were flagged.
Evaluation Metrics
Area Under the ROC Curve (AUC)
\[\text{AUC} = P(\hat{r}_{\text{at risk}} > \hat{r}_{\text{not at risk}})\]The probability that a randomly chosen at-risk student receives a higher predicted risk than a randomly chosen student who is not at risk.
Precision of the Flag
\[\text{Precision} = \frac{1}{|F|}\sum_{j \in F} \mathbb{1}\left[y_j = 1\right]\]The share of flagged students $F$ whose final result was Fail or Withdrawn.
Share of Students Whose Flag Changed
\[\text{Share} = \frac{1}{N}\sum_{j=1}^{N} \mathbb{1}\left[\text{flag}^{\text{raw}}_j \ne \text{flag}^{\text{clean}}_j\right]\]The share of test students, among those present in both versions, whose flag differed between the raw and cleaned versions.
Results
Cleaning Log
| Table | Rule | Action | Rows affected |
|---|---|---|---|
assessments | Missing exam date | Imputed | 11 |
studentInfo | 10-20 without percent sign | Recoded | 3,516 |
studentRegistration | Registration without a studentInfo row | Removed | 0 |
studentRegistration | Unregistered on or before day 0 | Flagged | 3,097 |
studentRegistration | Result and unregistration date conflict | Flagged | 102 |
studentAssessment | Orphan assessment or student, score outside 0-100 | Removed | 0 |
studentAssessment | Duplicate (student, assessment) | Removed | 0 |
studentAssessment | Missing score | Flagged | 173 |
studentVle | Orphan site or student, non-positive clicks, date range | Removed | 0 |
studentVle | Duplicate (student, site, date) | Collapsed | 2,195,960 |
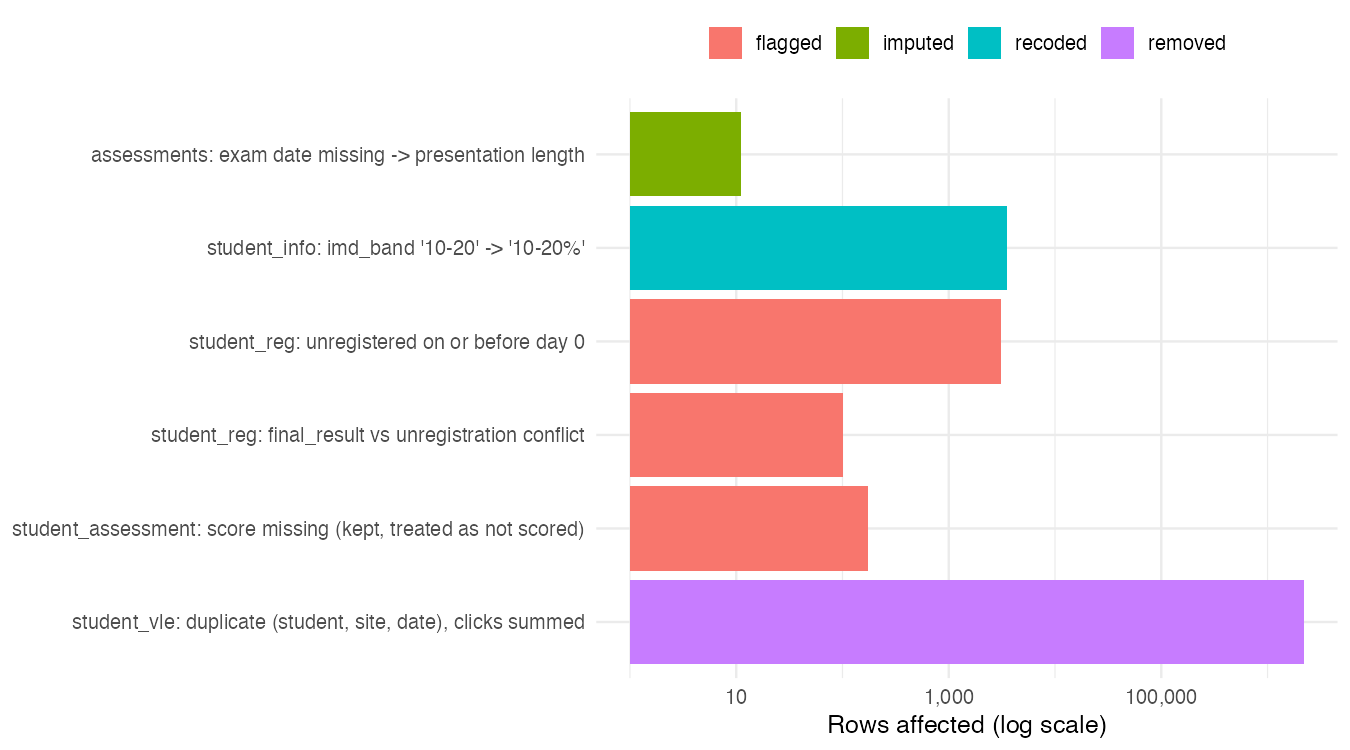
As shown in the figure, the duplicate-key rule in the click log affected the most rows, followed by the imd_band recode and the never-started flag.
The log recorded 14 rules, and 8 of them affected zero rows. No registration, submission, or click record pointed to a missing parent row. No score fell outside the range 0-100, no click record had a non-positive count or a date outside the presentation, and no student had two submissions for one assessment. The cleaned tables therefore differ from the raw tables through the six remaining rules, reported below by problem.
Students Who Never Started
3,097 registrations, 9.5% of the 32,593, had an unregistration date on or before day 0. The cleaned feature table excluded them. The raw feature table had 32,593 enrollments and the cleaned table 29,402, and the never-started rule accounts for 3,097 of the 3,191 enrollments removed. A model built on the raw tables scores these registrations, and a model built on the cleaned tables does not.
Contradictory Status
102 registrations, 0.3% of the 32,593, had a final result and an unregistration date that disagreed. Eight of them were also flagged as never started. The two rules together excluded 3,191 enrollments, 9.8% of the raw feature table, so the status rule added 94 exclusions beyond the never-started rule.
Inconsistent Coding
The imd_band recode changed 3,516 rows, 10.8% of the 32,593 student records. The exam-date rule imputed 11 of the 206 assessment dates. The missing-score rule flagged 173 of the 173,912 submissions and kept them as not scored. None of the seven week-4 features reads imd_band or an exam date, and the feature query sets a missing first-TMA score to zero in the raw and cleaned versions alike. These three rules changed no feature value. They apply to any analysis that groups by imd_band or joins on exam dates.
Duplicate Keys in the Click Log
The collapse reduced the click log from 10,655,280 rows to 8,459,320. It removed 2,195,960 rows, 20.6% of the log. The week-4 click features are a sum of clicks, a count of distinct dates, and the latest click date. All three are invariant to how the clicks of one student, site, and day are split across rows, so the collapse changed no feature value. With the other click-log rules at zero rows, every difference between the two feature tables came from the 3,191 excluded registrations.
Flag Before and After Cleaning
| Raw tables | Cleaned tables | |
|---|---|---|
| Enrollments scored (2014) | 19,064 | 17,105 |
| Students flagged | 4,582 | 3,421 |
| Flags on registrations excluded by cleaning | 1,738 | 0 |
| AUC on own test set | 0.763 | 0.712 |
| AUC on students present in both versions | 0.715 | 0.712 |
| Precision of top-20% flag | 0.864 | 0.763 |
The raw version flagged 4,582 of 19,064 test enrollments, 24.0% against the intended 20%. The flag includes every student at or above the 80th percentile of predicted risk, and the share exceeds 20% when predicted risks are tied at that value. Of the 4,582 flags, 1,738 (37.9%) went to the 1,959 test registrations that the cleaning excluded. The raw version had an AUC of 0.763 and a flag precision of 0.864 on its own test set, against 0.712 and 0.763 for the cleaned version.
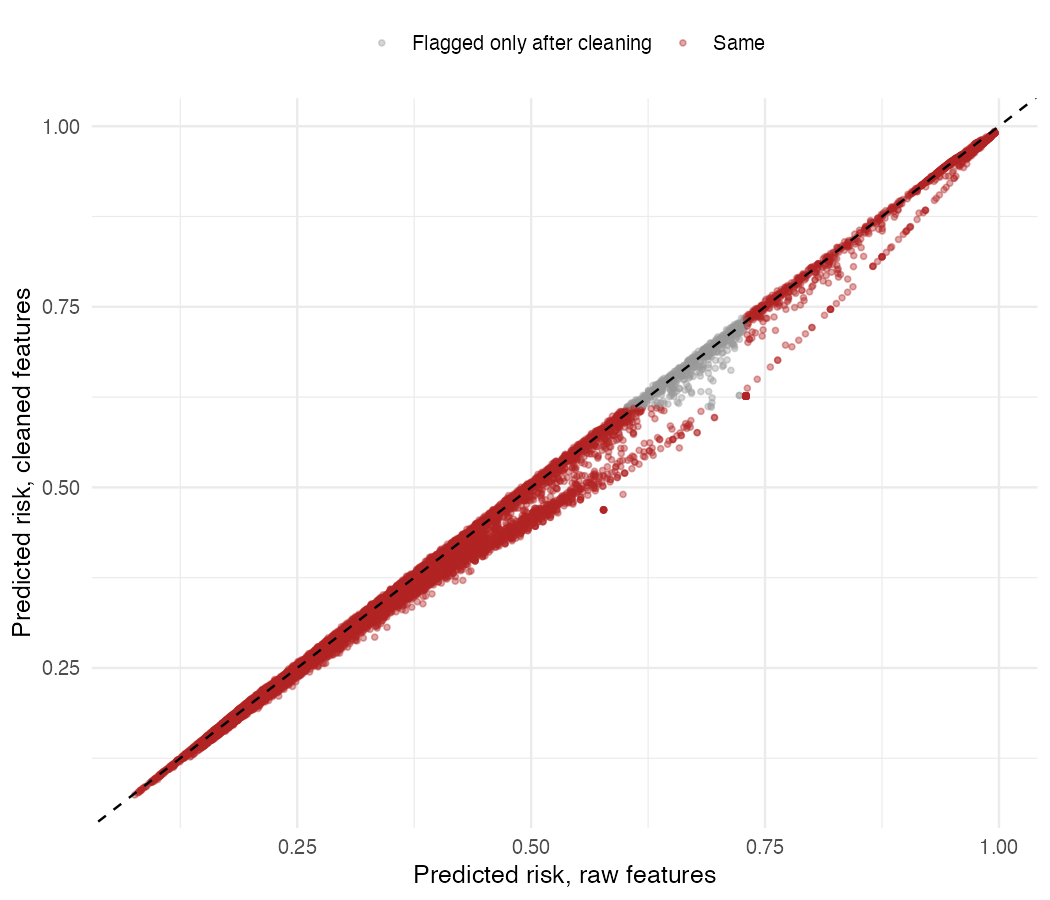
Among the 17,105 students present in both versions, all 2,844 students flagged by the raw model were also flagged by the cleaned model, and 577 (3.4%) were flagged after cleaning and not before. As shown in the figure, no student was flagged in the raw version alone. Evaluated on these same 17,105 students, the raw-trained and clean-trained models had AUCs of 0.715 and 0.712. Of the 0.051 difference in AUC between the two test sets, 0.048 came from the composition of the raw test set. The cleaned metrics describe the students a support team can contact.
Recommendation
Exclude never-started registrations before scoring and before reporting metrics
3,097 registrations ended on or before day 0. They are correctly labeled Withdrawn, and an in-course intervention cannot reach them. Leaving the 3,191 excluded registrations in sent 37.9% of the raw flags to them and raised the reported AUC from 0.712 to 0.763 and precision from 0.763 to 0.864.
Keep zero-row checks in the cleaning layer
The integrity checks found zero orphan rows, zero out-of-range scores, and zero duplicate submissions in this export. A non-zero count on a future export is the earliest warning that the source has changed.
Match the duplicate rule to the feature
Collapsing 2,195,960 duplicate click rows changed nothing for sum-based features, and it would change any row-count feature by about a fifth. Decide per feature whether rows or clicks are the unit before writing the aggregate.
Limitation
Duplicate click records were collapsed by summing, which assumes they are separate sessions and not a repeated export. If they are repeated exports, total clicks are overstated in the raw and cleaned features alike, and the comparison between the two versions is unaffected.
Code
1
2
3
4
5
6
7
8
9
10
11
12
13
14
15
16
17
18
19
20
21
22
23
24
25
26
27
28
29
30
31
32
33
34
35
36
37
38
39
40
41
42
43
44
45
46
47
48
49
50
51
52
53
54
55
56
57
58
59
60
61
62
63
64
65
66
67
68
69
70
71
72
73
74
75
76
77
78
79
80
81
82
83
84
85
86
87
88
89
90
91
92
93
94
95
96
97
98
99
100
101
102
103
104
105
106
107
108
109
110
111
112
113
114
115
116
117
118
119
120
121
122
123
124
125
126
127
128
129
130
131
132
133
134
135
136
137
138
139
140
141
142
143
144
145
146
147
148
149
150
151
152
153
154
155
156
157
158
159
160
161
162
163
164
165
166
167
168
169
170
171
172
173
174
175
176
177
178
179
180
181
182
183
184
185
186
187
188
189
190
191
192
193
194
195
196
197
198
199
200
201
202
library(DBI)
library(duckdb)
library(tidyverse)

con <- dbConnect(duckdb(), dbdir = "oulad.duckdb")
q <- function(sql) dbGetQuery(con, sql)
x <- function(sql) invisible(dbExecute(con, sql))
n <- function(tbl) q(str_glue("SELECT COUNT(*) AS n FROM {tbl}"))$n

cleaning_log <- tibble()
log_step <- function(table, rule, action, before, after) {
  cleaning_log <<- bind_rows(cleaning_log, tibble(table, rule, action, before, after, changed = before - after))
}

auc <- function(score, y) {
  r <- rank(score)
  n1 <- sum(y == 1)
  (sum(r[y == 1]) - n1 * (n1 + 1) / 2) / (n1 * sum(y == 0))
}

if (!dir.exists("oulad")) {
  download.file("https://ndownloader.figshare.com/articles/5081998/versions/1", "oulad.zip", mode = "wb")
  unzip("oulad.zip", exdir = "oulad")
  walk(list.files("oulad", "\\.zip$", full.names = TRUE), ~ unzip(.x, exdir = "oulad"))
}

tables <- c(
  courses = "courses.csv",
  assessments = "assessments.csv",
  vle = "vle.csv",
  student_info = "studentInfo.csv",
  student_reg = "studentRegistration.csv",
  student_assessment = "studentAssessment.csv",
  student_vle = "studentVle.csv"
)

iwalk(tables, ~ x(str_glue("CREATE TABLE {.y} AS SELECT * FROM read_csv_auto('oulad/{.x}', header = true, nullstr = ['', '?'])")))

x("CREATE TABLE assessments_clean AS
   SELECT a.id_assessment, a.code_module, a.code_presentation, a.assessment_type, a.weight,
          COALESCE(a.\"date\", c.module_presentation_length) AS \"date\",
          a.\"date\" IS NULL AS date_imputed
   FROM assessments a JOIN courses c USING (code_module, code_presentation)")
log_step("assessments", "exam date missing -> presentation length", "imputed",
         n("assessments"), n("assessments") - q("SELECT COUNT(*) AS n FROM assessments_clean WHERE date_imputed")$n)

x("CREATE TABLE student_info_clean AS
   SELECT * REPLACE (CASE WHEN imd_band = '10-20' THEN '10-20%' ELSE imd_band END AS imd_band)
   FROM student_info")
log_step("student_info", "imd_band '10-20' -> '10-20%'", "recoded",
         n("student_info"), n("student_info") - q("SELECT COUNT(*) AS n FROM student_info WHERE imd_band = '10-20'")$n)

x("CREATE TABLE student_reg_clean AS
   SELECT r.*,
          COALESCE(r.date_unregistration <= 0, FALSE) AS never_started,
          (s.final_result = 'Withdrawn') <> (r.date_unregistration IS NOT NULL) AS status_conflict
   FROM student_reg r JOIN student_info_clean s USING (code_module, code_presentation, id_student)")
log_step("student_reg", "registration without student_info row", "removed", n("student_reg"), n("student_reg_clean"))
log_step("student_reg", "unregistered on or before day 0", "flagged",
         n("student_reg_clean"), n("student_reg_clean") - q("SELECT COUNT(*) AS n FROM student_reg_clean WHERE never_started")$n)
log_step("student_reg", "final_result vs unregistration conflict", "flagged",
         n("student_reg_clean"), n("student_reg_clean") - q("SELECT COUNT(*) AS n FROM student_reg_clean WHERE status_conflict")$n)

x("CREATE TABLE sa1 AS
   SELECT sa.*, a.code_module, a.code_presentation, a.\"date\" AS due_date
   FROM student_assessment sa JOIN assessments_clean a USING (id_assessment)")
log_step("student_assessment", "assessment id not in assessments", "removed", n("student_assessment"), n("sa1"))

x("CREATE TABLE sa2 AS SELECT sa.* FROM sa1 sa JOIN student_info_clean USING (code_module, code_presentation, id_student)")
log_step("student_assessment", "student not in student_info", "removed", n("sa1"), n("sa2"))

x("CREATE TABLE sa3 AS SELECT * FROM sa2 WHERE score IS NULL OR score BETWEEN 0 AND 100")
log_step("student_assessment", "score outside 0-100", "removed", n("sa2"), n("sa3"))

x("CREATE TABLE student_assessment_clean AS
   SELECT * EXCLUDE (rk) FROM (
     SELECT *, ROW_NUMBER() OVER (PARTITION BY id_student, id_assessment ORDER BY date_submitted DESC, score DESC NULLS LAST) AS rk
     FROM sa3)
   WHERE rk = 1")
log_step("student_assessment", "duplicate (student, assessment), keep latest", "removed", n("sa3"), n("student_assessment_clean"))
log_step("student_assessment", "score missing (kept, treated as not scored)", "flagged",
         n("student_assessment_clean"), n("student_assessment_clean") - q("SELECT COUNT(*) AS n FROM student_assessment_clean WHERE score IS NULL")$n)

x("CREATE TABLE sv1 AS SELECT sv.* FROM student_vle sv JOIN vle USING (id_site, code_module, code_presentation)")
log_step("student_vle", "id_site not in vle", "removed", n("student_vle"), n("sv1"))

x("CREATE TABLE sv2 AS SELECT sv.* FROM sv1 sv JOIN student_reg_clean USING (code_module, code_presentation, id_student)")
log_step("student_vle", "student not in registration", "removed", n("sv1"), n("sv2"))

x("CREATE TABLE sv3 AS
   SELECT sv.* FROM sv2 sv JOIN courses c USING (code_module, code_presentation)
   WHERE sv.sum_click > 0 AND sv.\"date\" BETWEEN -30 AND c.module_presentation_length")
log_step("student_vle", "non-positive clicks or date outside presentation", "removed", n("sv2"), n("sv3"))

x("CREATE TABLE student_vle_clean AS
   SELECT code_module, code_presentation, id_student, id_site, \"date\", SUM(sum_click) AS sum_click, COUNT(*) AS n_source_rows
   FROM sv3 GROUP BY ALL")
log_step("student_vle", "duplicate (student, site, date), clicks summed", "collapsed", n("sv3"), n("student_vle_clean"))

walk(c("sa1", "sa2", "sa3", "sv1", "sv2", "sv3"), ~ x(str_glue("DROP TABLE {.x}")))
write_csv(cleaning_log, "output/cleaning_log.csv")

feature_sql <- function(info, reg, vle, sa, assess, where_reg = "TRUE") str_glue("
  WITH base AS (
    SELECT s.code_module, s.code_presentation, s.id_student,
           (s.final_result IN ('Fail', 'Withdrawn'))::INT AS at_risk
    FROM {info} s JOIN {reg} r USING (code_module, code_presentation, id_student)
    WHERE {where_reg}
  ),
  clicks AS (
    SELECT code_module, code_presentation, id_student,
           SUM(sum_click) AS clicks, COUNT(DISTINCT \"date\") AS active_days, 28 - MAX(\"date\") AS days_since_last
    FROM {vle} WHERE \"date\" <= 28 GROUP BY ALL
  ),
  tma1 AS (
    SELECT code_module, code_presentation, id_assessment, \"date\" AS due_date
    FROM (SELECT *, ROW_NUMBER() OVER (PARTITION BY code_module, code_presentation ORDER BY \"date\") AS rk
          FROM {assess} WHERE assessment_type = 'TMA')
    WHERE rk = 1 AND due_date <= 28
  ),
  sub AS (
    SELECT t.code_module, t.code_presentation, sa.id_student,
           MAX(sa.score) AS tma1_score, MAX((sa.date_submitted > t.due_date)::INT) AS tma1_late
    FROM {sa} sa JOIN tma1 t USING (id_assessment) GROUP BY ALL
  )
  SELECT b.*,
         COALESCE(c.clicks, 0) AS clicks,
         COALESCE(c.active_days, 0) AS active_days,
         COALESCE(c.days_since_last, 58) AS days_since_last,
         (t.code_module IS NOT NULL)::INT AS tma1_due,
         COALESCE(s.tma1_score, 0) AS tma1_score,
         (t.code_module IS NOT NULL AND s.id_student IS NULL)::INT AS tma1_missing,
         COALESCE(s.tma1_late, 0) AS tma1_late
  FROM base b
  LEFT JOIN clicks c USING (code_module, code_presentation, id_student)
  LEFT JOIN tma1 t USING (code_module, code_presentation)
  LEFT JOIN sub s USING (code_module, code_presentation, id_student)")

feat_raw <- q(feature_sql("student_info", "student_reg", "student_vle", "student_assessment", "assessments")) %>% as_tibble()
feat_clean <- q(feature_sql("student_info_clean", "student_reg_clean", "student_vle_clean", "student_assessment_clean", "assessments_clean",
                            where_reg = "NOT r.never_started AND NOT r.status_conflict")) %>% as_tibble()

dbDisconnect(con, shutdown = TRUE)

fit_eval <- function(d) {
  m <- glm(at_risk ~ log1p(clicks) + active_days + days_since_last + tma1_due + tma1_score + tma1_missing + tma1_late,
           data = filter(d, str_starts(code_presentation, "2013")), family = binomial)
  d %>%
    filter(str_starts(code_presentation, "2014")) %>%
    mutate(risk = predict(m, ., type = "response"), flag = risk >= quantile(risk, 0.8))
}

test_raw <- fit_eval(feat_raw)
test_clean <- fit_eval(feat_clean)

both <- inner_join(
  test_raw %>% select(code_module, code_presentation, id_student, at_risk, risk_raw = risk, flag_raw = flag),
  test_clean %>% select(code_module, code_presentation, id_student, risk_clean = risk, flag_clean = flag),
  by = c("code_module", "code_presentation", "id_student")
) %>%
  mutate(change = case_when(flag_raw == flag_clean ~ "Same", flag_clean ~ "Flagged only after cleaning", TRUE ~ "Flagged only in raw"))

model_summary <- tibble(
  version = c("raw", "clean"),
  n_students = c(nrow(feat_raw), nrow(feat_clean)),
  n_test = c(nrow(test_raw), nrow(test_clean)),
  n_flagged = c(sum(test_raw$flag), sum(test_clean$flag)),
  auc_own_test = c(auc(test_raw$risk, test_raw$at_risk), auc(test_clean$risk, test_clean$at_risk)),
  auc_started = c(auc(both$risk_raw, both$at_risk), auc(both$risk_clean, both$at_risk)),
  flag_precision = c(mean(test_raw$at_risk[test_raw$flag]), mean(test_clean$at_risk[test_clean$flag]))
)

flag_table <- count(both, flag_raw, flag_clean)
n_flag_never_started <- test_raw %>% anti_join(both, by = c("code_module", "code_presentation", "id_student")) %>% pull(flag) %>% sum()

write_csv(model_summary, "output/model_summary.csv")


theme_portfolio <- theme_minimal(base_size = 13) + theme(panel.grid.minor = element_blank(), legend.position = "bottom")

p1 <- cleaning_log %>%
  filter(changed > 0) %>%
  mutate(label = fct_rev(fct_inorder(str_c(table, ": ", rule)))) %>%
  ggplot(aes(changed, label, fill = action)) +
  geom_col() +
  scale_x_log10(labels = scales::comma) +
  labs(x = "Rows affected (log scale)", y = NULL, fill = NULL) +
  theme_portfolio
ggsave("output/figure1.png", p1, width = 9, height = 5, dpi = 200)

p2 <- ggplot(both, aes(risk_raw, risk_clean, color = change)) +
  geom_point(alpha = 0.4, size = 1) +
  geom_abline(linetype = 2, color = "#3C8DCC") +
  scale_color_manual(values = c("Same" = "grey60", "Flagged only after cleaning" = "#D62728", "Flagged only in raw" = "#3C8DCC")) +
  labs(x = "Predicted risk, raw features", y = "Predicted risk, cleaned features", color = NULL) +
  theme_portfolio
ggsave("output/figure2.png", p2, width = 7, height = 6, dpi = 200)

print(cleaning_log, n = Inf, width = Inf)
print(model_summary, width = Inf)
print(flag_table)
n_flag_never_started